Why Embedded Systems Need Runtime Observability — Even After the Code Ships
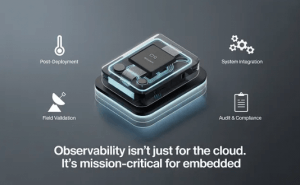
In embedded systems, success isn’t defined by passing tests or compiling code — it’s defined by how your system behaves under real-world conditions. That’s why more engineering teams are adopting runtime observability, not just during development, but across the entire delivery lifecycle.
The question is no longer “Did it build?”
It’s “Is it behaving the way we designed it to — right now, in the field?”
The truth about traceability
Ask most embedded engineers what they think about traceability, and you’ll probably get a groan. It’s usually associated with audits, checklists, or hours of documentation that pull you away from actual engineering.
But in reality, traceability is not about bureaucracy — it’s about knowledge reuse and risk reduction. When done right, it becomes a silent productivity multiplier inside your DevOps process.
The Hidden Cost of CI/CD Success
Modern pipelines (like those built in GitLab) are excellent at validating code against predefined tests. But for embedded systems — especially those operating in regulated environments — that’s often not enough.
Consider:
- A firmware update causes unexpected CPU spikes in production
- A hardware integration introduces latency too subtle for test rigs to detect
- A component regression only surfaces under specific load or environmental conditions
These issues often escape the CI/CD pipeline entirely — and surface only during late-stage testing, system integration, or in production environments.
What Is Runtime Observability?
Runtime observability is the ability to understand how your system is performing in real time, using metrics, logs, traces, and alerts.
This visibility is critical for:
- Detecting performance degradation
- Diagnosing root causes faster
- Tracing issues back to specific deployments or commits
- Supporting audits and compliance reviews
In cloud-native environments, tools like Instana, Prometheus, or OpenTelemetry are widely used. Increasingly, these same concepts are being adapted for embedded and edge systems — with lightweight agents, edge gateways, or log/metric collectors that feed into centralized platforms.
A Practical Example
A robotics team managing sensor-driven edge systems deploys firmware using GitLab pipelines. Their test suite passes. But in the field, some units begin exhibiting unpredictable sensor lag.
By integrating observability tools (e.g., Instana or custom telemetry) with their deployment process, the team can:
- Mark exactly when and what was deployed
- Track system behavior changes in real time
- Trace sensor performance regressions back to a specific job or commit
- Roll back or patch rapidly, with data-backed confidence
Without observability, the team would be left to manually debug logs, recreate conditions, or guess at the root cause — costing days of effort and risking SLA violations.
Observability Isn’t a Nice-to-Have — It’s the Other Half of Engineering
For embedded systems, especially in regulated industries, observability helps teams move faster without breaking trust. It allows you to:
- Trace behavior to root cause
- Align testing with what’s actually happening in the field
- Prove system reliability and compliance — not just hope for it
Tools like GitLab and Instana show how this can be done today, but the bigger message is this: Observability completes the development lifecycle. Without it, you’re flying blind.
The rest of the story — Instana edition
IBM Instana was primarily designed for cloud-native, containerized, and distributed applications, but it can support embedded systems — especially when those systems:
- Run Linux-based OSes (like embedded Linux)
- Can expose metrics, logs, or traces (via agents, gateways, or APIs)
- Are part of a larger system (e.g., edge devices, IoT gateways) that interacts with cloud apps or microservices
How it works for embedded use cases:
- Edge Monitoring: Instana can monitor services running on edge nodes or gateways connected to embedded systems.
- Custom Metrics: Developers can push custom metrics or traces from embedded apps via Instana’s APIs.
- Event Correlation: Instana can mark deployments from CI/CD tools (e.g., GitLab) and correlate them with runtime issues — even if the code runs on edge or hybrid systems.
Instana caveats:
— Instana’s not suited for deeply constrained devices (e.g., MCUs with limited RAM/CPU).
— An agent-based install may not work directly on bare-metal or RTOS systems.
— A proxy or gateway pattern (sending data upstream) is usually necessary.
Good Use Cases:
— Embedded Linux devices in automotive, medical, or robotics
— Gateways aggregating telemetry from multiple devices
— Regulated systems needing deployment-to-runtime traceability
Need Help Making This Work?
At 321Gang, we work with engineering teams in aerospace, automotive, medical, and beyond to connect tools like Instana, GitLab, IBM ELM, and observability platforms for real-world impact.
Your code might compile — but does your system perform? Observability helps you know, not guess.

321Gang | 14362 North FLW | Suite 1000 | Scottsdale, AZ 85260 | 877.820.0888

